Playwright trace viewer: debug a failing screenshot
Use the Playwright trace viewer to debug a toHaveScreenshot failure that passed locally: the snapshot, Log, Network and Attachments tabs, and all seven trace modes.
 Igor LuchenkovBuilding UI Verify
On this page
"It passed locally." Every team that runs Playwright screenshot tests in CI says it about once a week, and it is usually true. Our billing page test passed on a laptop in 200 milliseconds. In the CI-like run it failed both attempts with 9,159 pixels different, and the error message said only that the pixels differ. The Playwright trace viewer is how you find out why, and on this failure it answered the question in four tabs.
The Playwright trace viewer is a tool for opening a recorded Playwright test run and stepping through it action by action: a DOM snapshot before and after each step, the internal log of what Playwright did, the console, every network request, and any files the test attached. You record a trace with the trace option and open it with npx playwright show-trace, or by dropping the zip on trace.playwright.dev, which opens it locally in your browser without uploading it. Everything below was run on Playwright 1.64.1 on 2026-11-02.
How do you record a Playwright trace in CI?
Set trace in playwright.config.ts. The setting the docs recommend for CI is trace: 'on-first-retry' together with retries: 1, which records only when a failing test is retried. Without retries it never records anything, a detail at least one popular tutorial gets wrong. If you do not use retries, retain-on-failure records every run and keeps the trace only when the test fails. The docs list five modes; the 1.64.1 type definitions have seven.
export default defineConfig({
  retries: process.env.CI ? 1 : 0,
  use: { trace: "on-first-retry" },
});
When a traced test fails, the terminal output tells you where the trace is. Ours printed the exact command under the failure, npx playwright show-trace test-results/billing-billing-page-matches-the-design-retry1/trace.zip. In CI you upload test-results/ as an artifact, download it, and run that command. The trace for this test was 100 KB.
The failure: a screenshot test that passed locally
The test is ordinary. It opens a billing page, waits for the Update card button, and compares the page against a baseline with toHaveScreenshot. The page renders a skeleton first, then fetches usage data and fills in "8,240 of 10,000 min". On the laptop the API answered in about 5 milliseconds. For the CI-like run we slowed the API to 400 milliseconds, staged on the same machine to stand in for a slower backend, so the only thing that changed was latency.
What does the trace viewer show for a failed screenshot?
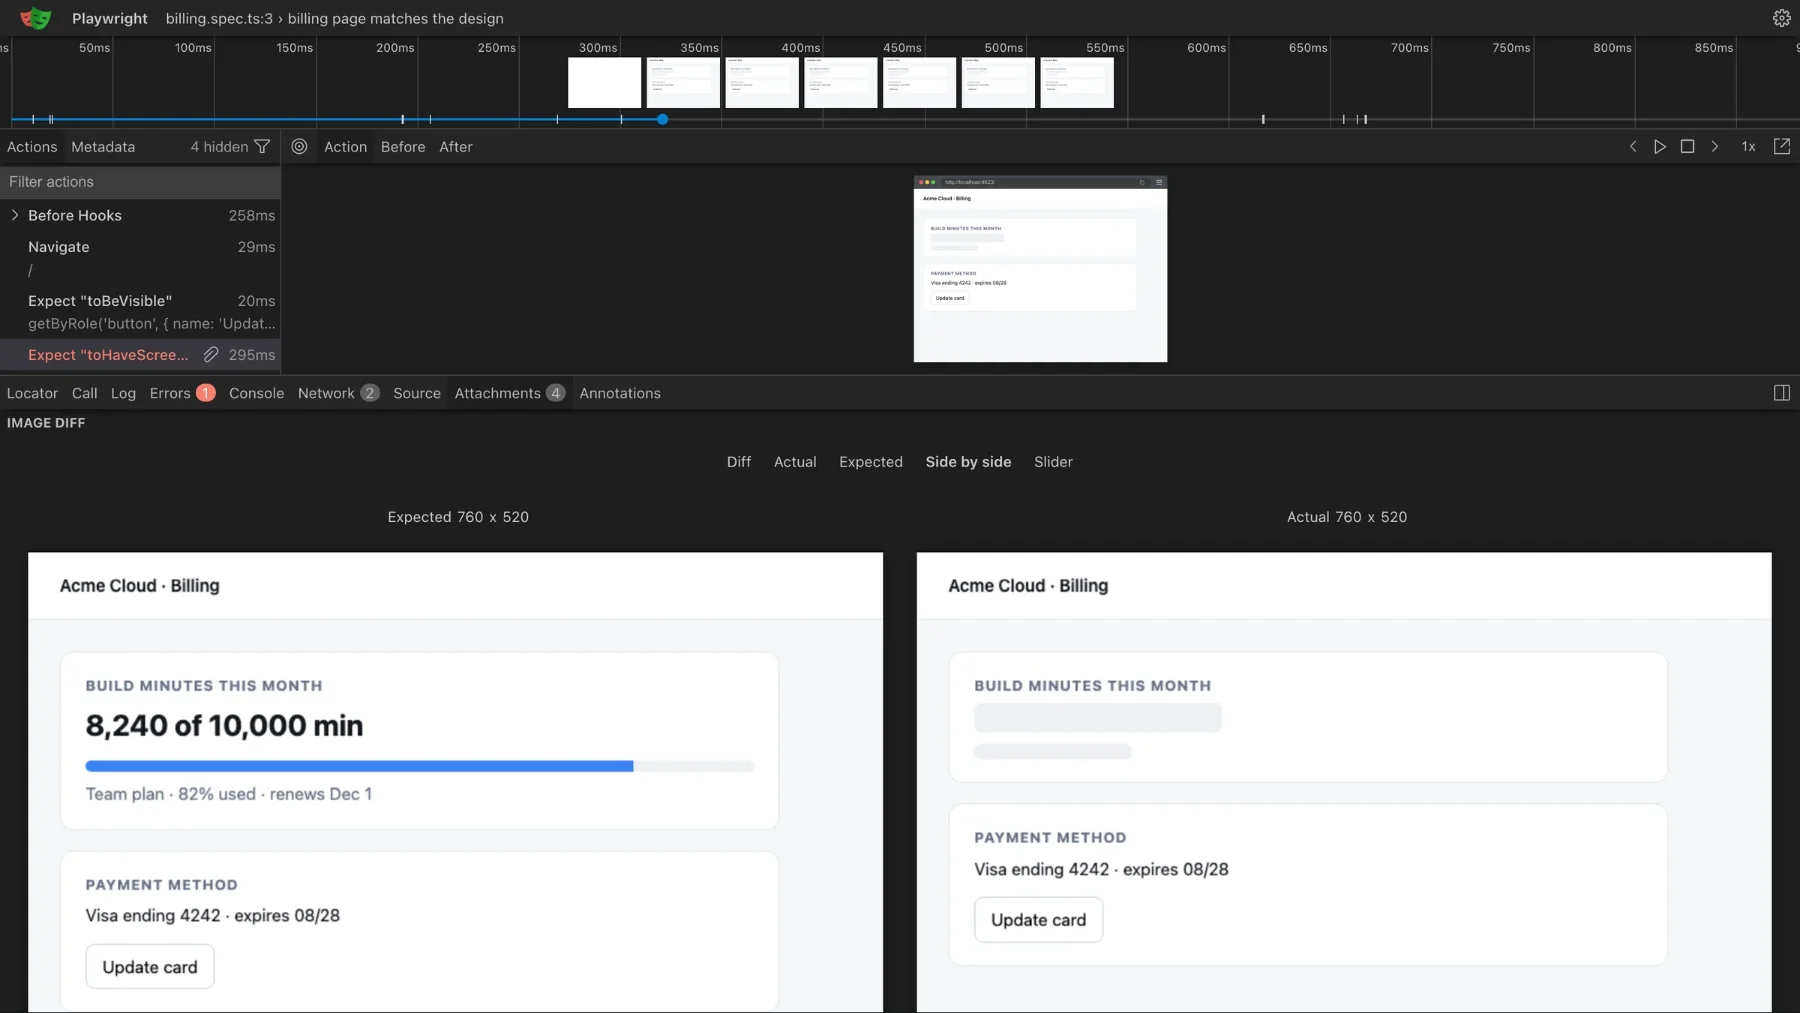
The page as Playwright saw it at the failing step, and the reason it compared that version. Click the failed toHaveScreenshot action in the Actions list and the snapshot pane shows the DOM at that moment. Ours showed the usage card still as grey placeholder bars. The snapshot is a real DOM you can inspect, not a picture, with Before, Action, and After tabs for each step.
The Log tab explains why Playwright compared a skeleton instead of waiting for the data. toHaveScreenshot compares its first screenshot against the baseline. If that fails, it takes more screenshots until two consecutive ones are identical, then compares that stable one, once. In our trace the second screenshot came 102 milliseconds after the first, matched it, and the log reads "captured a stable screenshot" just before the second failure. A skeleton that holds still for a tenth of a second counts as stable. The assertion does not keep retrying until its 5-second timeout in the hope the page eventually matches, which is what many people assume.
The Network tab has the clue that turns a symptom into a cause. The /api/usage request started at 283 milliseconds and shows as canceled with no duration: the test had finished and closed the page before the slower API answered. The Console tab was empty for the same reason, since the page's "usage loaded" log never ran. When a screenshot shows a loading state, look for the request that should have filled it.
Finally, the Attachments tab holds the three images the assertion saved, expected, actual, and diff, with Diff, Actual, Expected, Side by side, and Slider views. The diff marks the missing numbers in red; the slider lets you drag between the skeleton and the baseline. This is the view to start with when the cause is not obvious, because it shows exactly which region changed.
How do you fix a screenshot of a loading state?
Wait for the content, not for the frame around it. The test waited for the Update card button, which renders before the data arrives. Changing the wait to the data itself, await expect(page.getByText('8,240 of 10,000 min')).toBeVisible(), fixed it. In the new trace that assertion polled for 817 milliseconds, the usage request returned 200 in 402 milliseconds, and toHaveScreenshot matched on its first comparison in 42 milliseconds.
The filmstrip at the top of the passing trace shows the same thing over time: skeleton frames, then frames with the data, then the screenshot step. If your page has several sources of late content, a web font, an avatar, a second request, the filmstrip is the quickest way to see which one arrives last. Our flaky tests guide covers the other causes of runs that differ, and fix flaky Playwright screenshot tests covers clocks, animations, and fonts.
Can a coding agent read a Playwright trace?
Yes. Since Playwright 1.59 there is npx playwright trace, a command-line reader built for agents: open a trace, then list actions, requests, console, errors, or attachments, or dump the snapshot of one action. On our failing trace, requests listed the usage call as ERR with no duration and console reported no entries, the same two clues the viewer showed, in text an agent can read. The Errors tab in the viewer also has a Copy prompt button that packages the error, an accessibility snapshot of the page, and the test source for pasting into a chat.
If an agent is repairing your tests, give it the trace before it edits anything. In our Playwright test agents runs, the healer worked from the error and the diff images without opening a trace, and on screenshot failures it often skipped the test instead of finding the cause.
Traces for why, visual review for what changed
A trace answers why a particular run failed. It is less suited to the other question a screenshot failure raises: is this change intended? UI Verify, our visual regression testing tool for coding agents, handles that one. It captures the pages your Playwright tests open, renders them in one pinned browser so a Mac and a Linux runner agree, and shows every change on the pull request as a review page with the baseline, the diff, and a verdict on whether it looks intended, which your agent can also read over MCP.
The loading-state lesson applies there too: wait for the content before the test ends, so the capture shows the loaded page. The Playwright quickstart has the setup, and UI Verify vs Playwright screenshots compares the two approaches. The free plan includes 10,000 snapshots a month; for open-source projects it is 50,000.
See visual changes on the pull request, not in a zip
UI Verify captures your Playwright tests, diffs them in one pinned browser, and puts each change on the pull request with a verdict, for you and your coding agent.
Start for freeNo credit card required.
Deterministic Playwright captures
Stop real-page diffs that flake without a real change.