Chrome DevTools MCP: what it shows your coding agent
Chrome DevTools MCP gives coding agents performance traces, console errors and network requests. Setup, the 32 tools, and what it measured on a real page.
 Igor LuchenkovBuilding UI Verify
On this page
Frontend bugs an agent introduces tend to come in two kinds. Some change how the page runs: a request that 404s, an error in the console, a script that blocks the first paint. Others change how the page looks: a banner that pushes the hero down, a button that lost its color. The first kind leaves evidence in DevTools. The second kind often leaves none, and a tool that reads DevTools will tell you the page is healthy.
Chrome DevTools MCP is the Chrome DevTools team's Model Context Protocol server, chrome-devtools-mcp on npm, that lets a coding agent drive Chrome and read what DevTools sees: performance traces with Core Web Vitals and insights, console messages with source-mapped stack traces, network requests with headers and bodies, Lighthouse audits, and screenshots. The team's launch post described agents without it as "programming with a blindfold on" (developer.chrome.com, 2025-09-23). We ran version 1.12.0, the current release on 2026-11-02, against our demo shop to see what it reports on a real change.
How do you add Chrome DevTools MCP to Claude Code?
One command. The project's documented line is claude mcp add chrome-devtools --scope user npx chrome-devtools-mcp@latest; we pinned the version and used project scope so it lands in the committed .mcp.json:
claude mcp add --scope project chrome-devtools -- npx -y chrome-devtools-mcp@1.12.0It runs as a local stdio process, needs Node.js LTS and a current Chrome, and supports Chrome and Chrome for Testing only. There is also a Claude Code plugin that bundles the server with the project's agent skills: /plugin marketplace add ChromeDevTools/chrome-devtools-mcp, then install it. Two defaults are worth changing before you point it at an internal URL: it collects usage statistics (--no-usage-statistics turns that off), and its performance tools may send trace URLs to Google's Chrome UX Report API to fetch field data (--no-performance-crux turns that off).
What tools does Chrome DevTools MCP have?
Version 1.12.0 exposes 32 tools by default, counted from the server's own tools/list. They fall into input (click, fill, type, upload), navigation (open pages, switch between them, wait for text), emulation (one emulate call that sets CPU and network throttling, viewport, color scheme, and more), performance (start and stop a trace, analyze an insight), network (list requests, read one), debugging (evaluate script, console messages, CSS styles, Lighthouse, screenshot, accessibility snapshot, screencast), and a heap snapshot. --slim cuts it to three tools; --memoryDebugging raises it to 45.
Older guides are out of date in two places. Network throttling used to be its own tool, emulate_network; it is now part of emulate. And since 1.8.0 every page-scoped call takes a pageId, so the server can route several agents to their own tabs. Examples copied from 2025 posts fail on both. The Lighthouse tool covers accessibility, SEO, and best practices but not performance; for performance, the tool description sends you to the trace.
A real run: a banner that loads late
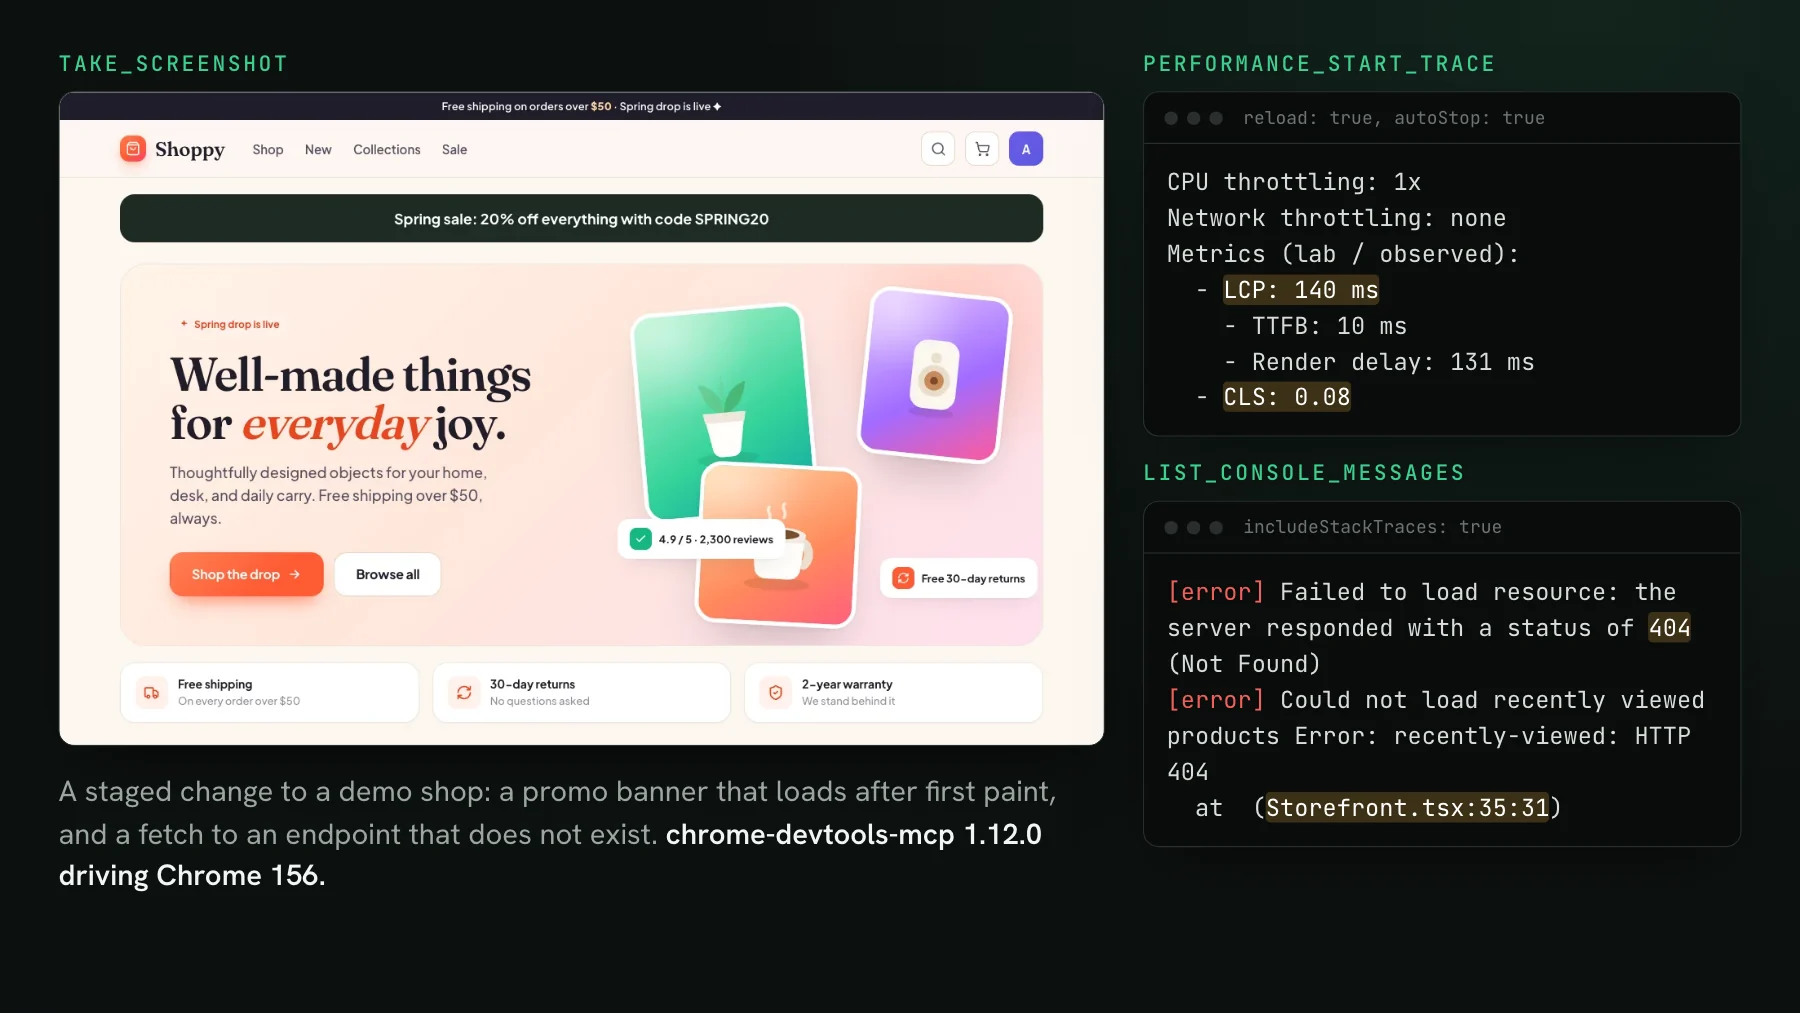
To give the server something to find, we staged one commit on our demo storefront and said so here: a promo banner fetched after first paint and inserted above the hero with no reserved space, and a fetch to an endpoint that does not exist, logged with console.error. We served the production build locally, then had a script call the server the way an agent would: navigate, start a trace with a reload, read the console, list the network requests, and take a screenshot. Each run used a fresh isolated browser, and we ran every condition at least three times.
The trace caught the shift. Cumulative Layout Shift went from 0.03 to 0.08 in ten of ten traces (five before, five after), and from 0.02 to 0.06 under throttling. It also caught the broken request: the console showed the 404 and our error, and with source maps on, the stack trace pointed at Storefront.tsx:35:31, the exact line of the .catch. Without source maps, the same error pointed at a minified bundle offset and a 40-frame React stack. get_network_request then returned the failing request with its headers and the response body.
That pairing is where DevTools MCP is strongest. An agent that sees Storefront.tsx:35:31 and a 404 body can fix the bug without asking you to open DevTools and paste the error. Playwright MCP also lists console messages and network requests, so the difference is depth rather than access: source-mapped stacks, the trace and its insights, Lighthouse, the CSS cascade, and heap snapshots.
What did the performance insight say about the shift?
The CLS culprits insight listed two shifts and explained one of them. It traced the smaller shift to a web font swap. For the banner's shift, scored 0.0483, it reported "No potential root causes identified". An element injected by JavaScript after a fetch is the textbook layout shift, and the insight could see that something moved without saying why. The agent still has the screenshot and the code to reason from, but the insight alone does not hand it the answer.
The other thing worth knowing about the score: 0.08 is under Google's 0.1 threshold for a good CLS. A check that only compares the score to the threshold passes this change. The hero visibly moved for every visitor, and the number says the page is fine.
How much does throttling change LCP?
A lot, and almost all of it is network. Unthrottled, the median Largest Contentful Paint on our page was 156 ms. With emulate set to CPU 4x and Slow 4G together, it was 3,097 ms, twenty times slower. Splitting the two showed where the time goes: CPU 4x alone gave 411 ms, Fast 4G 759 ms, and Slow 4G alone 2,899 ms, the only setting that crossed web.dev's 2.5-second line for a good LCP. The trace's breakdown put almost all of it in render delay: the page waits for its JavaScript bundle before the text heading can paint.
One more thing from the measurements: a single trace is noisy. One of five unthrottled runs came back at 2,349 ms because a web font loaded slowly. Ask the agent to run a trace three times and take the median before it acts on a number. Each trace took 5 to 9 seconds and returned about 8,700 characters of text, so three is affordable. The tool definitions themselves are heavier: Claude Code priced the 32 at 14,185 tokens, which tool search defers until the agent uses one.
Chrome DevTools MCP vs Playwright MCP
| Chrome DevTools MCP 1.12.0 | Playwright MCP 0.0.84 | |
|---|---|---|
| Maintainer | Chrome DevTools team | Microsoft Playwright team |
| Tools by default | 32 | 25 |
| Browsers | Chrome, Chrome for Testing | Chrome, Firefox, WebKit, Edge |
| Performance trace with insights | Yes | No |
| Console and network | Yes, with source-mapped stacks | Yes |
| Lighthouse audit | Yes (no performance category) | No |
| Baseline or before/after | No | No |
Use Playwright MCP when the agent needs to drive a flow, across browsers, from an accessibility snapshot; our Playwright MCP guide covers it. Use DevTools MCP when the question is why: why the page is slow, why a request failed, why an element shifted. Many setups run both. Neither keeps a record of how the page looked before the change, which is the last row of the table and the gap that matters for UI work.
What neither server can tell the agent
DevTools MCP measures a page load. It does not know what the page looked like on main. Our banner scored a passing CLS, and a change that moves an element without a layout shift during load, such as a new line of copy that pushes a button down, scores nothing at all. To catch that, the agent needs the approved before next to the after. UI Verify is visual regression testing for coding agents: it diffs each capture against the baseline on your pull request and gives the agent the result through its MCP server.
That crop came from a pull request on our own dashboard that added Codex to a setup screen. The change was intended and accepted, which is the point of showing it to the agent: it can confirm the move matches what it meant to do, and catch the cases where it does not. The render_diff_image tool returns the before and after cropped to each changed region (the tool reference lists the rest), and `uiverify check` gets the agent the same answer before a pull request exists. UI Verify is free up to 10,000 snapshots a month, and up to 50,000 for open-source projects.
Show your agent what changed, not only how it ran
UI Verify diffs every UI change against the approved baseline and gives your coding agent the cropped before and after over MCP, next to the profiler and the browser.
Start for freeNo credit card required.
Triage a build from your agent
Bucket real regressions vs noise and accept baselines, over MCP.